Nifty Magic Analyser ( NiMA )

Live NIFTY option-chain analytics

NiMA stands out because it transforms raw NIFTY option-chain data into readable market-structure analytics. Most users struggle because they can see the data but cannot interpret positioning, structural pressure, sentiment shifts or institutional intent. NiMA’s architecture is increasingly solving exactly that problem. In other words, NiMA makes Option-Chain data to talk with the user.

NiMA AI helps users interpret writer pressure, PCR movement, support-resistance shifts, spot behavior, and Net Market Pressure without manually decoding every strike.

NiMA is an analytics and educational platform for market interpretation only. It does not provide advisory services, execution instructions, or guaranteed outcomes.

One screen Resistance, Spot, Support, OI Trends, Market Insights, and Ladder blocks.
6 windows Market Insights comparison periods from 3 minutes to 60 minutes.
-100/+100 Net Market Pressure scale for directional pressure interpretation.
NiMA Market Dashboard
LIVE
NiMA live dashboard preview
NiMA Analytics Charts
LIVE
NiMA live analytics charts preview
Core Features

Built for faster market interpretation.

NiMA transforms complex option-chain and market structure data into simplified real-time intelligence, helping users understand institutional positioning, evolving sentiment, available range, and structural market behavior with greater clarity.

OI

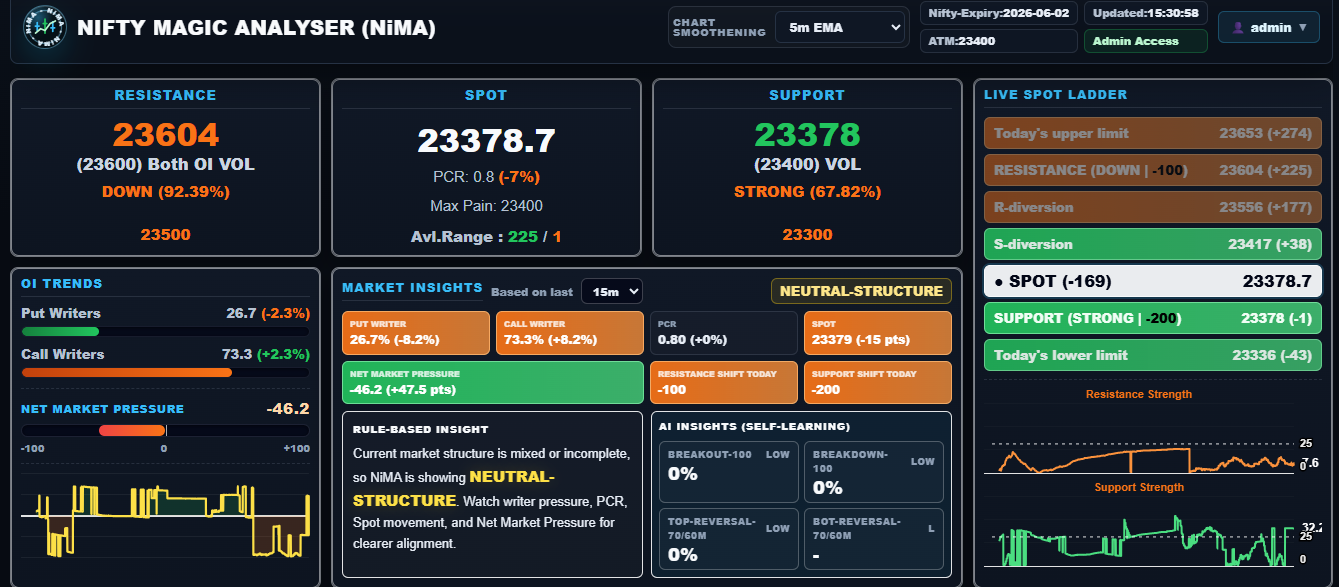
OI Trends & Net Pressure

Track put writer, call writer, PCR, market sentiment, and the -100 to +100 Net Market Pressure bar in one card.

SR

Resistance, Spot & Support Cards

Read finalized resistance, spot, and support blocks with tendency, strength comment, strike, and available range.

PCR

Selectable Insight Windows

Compare condition changes over 3, 5, 10, 15, 30, or 60 minutes directly inside the Market Insights card.

MS

Market Insight Conditions

See put writer, call writer, PCR, spot, and Net Market Pressure values with color-coded recent change blocks.

RS

Bullish, Bearish or Neutral Bias Context

Use the Market Insights rule engine to read directional context, watch zones, available range, and neutral conditions.

OC

Ladder, Charts & OC Table

Move from one-screen cards into live ladder context, chart confirmation, signal logs, and option-chain detail.

Trust & Access

Robust & Trustworthy platform in place.

NiMA now includes verified account access, protected login flows, clear policies, support contact details, and risk-first language across the user journey.

Verified accounts New subscribers must verify their email before login and dashboard access are enabled.
Abuse protection Login, signup, password reset, verification resend, and checkout confirmation routes are rate limited.
Policy pages Terms, Privacy Policy, Refund/Cancellation Policy, and Contact/Grievance details are available before purchase.
Analytics only Bullish, bearish, neutral, support, and resistance readings are market-context indicators, not investment guidance.
How It's Useful

Market structure clarity without manually decoding the option-chain.

NiMA is useful because it turns a messy NIFTY option chain into market-context readings that users can understand quickly.

Its strongest value is not “prediction”, but market structure clarity. A market observer looking at raw OI, volume, PCR, support, resistance, max pain, deltas, and strike movement can easily miss the bigger picture. NiMA helps by organizing those into readable zones: where resistance is building, where support is strengthening, whether put writers or call writers are gaining control, and whether spot is moving toward or away from important levels.

For users, it can help with:

  • Finding important Nifty levels: support, resistance & nearby strike pressure.
  • Understanding option writer behavior: whether put writers or call writers are more active.
  • Reading intraday shifts: changes over 3, 5, 10, 15, 30, and 60 minutes make it easier to see momentum changes.
  • Avoiding impulsive interpretation: WAIT or not-favorable conditions highlight when the structure is unclear.
  • Confirming bias: bullish, bearish, rangebound, expanding, or mixed flow conditions.
  • Seeing context, not just price: spot alone can mislead; option-chain pressure often explains why price stalls, rejects, or moves through a level.

The platform becomes most useful if users treat it like a market dashboard, not an execution prompt. It can answer: “Where is the pressure?”, “Is the level fresh or weakening?”, “Are writers supporting this move?”, and “Is this an expansion environment or a range environment?”

NiMA is designed for users who want to understand NIFTY option-chain behavior without manually decoding every data point.
How It Works

From raw option-chain data to readable market structure.

Advanced NIFTY market intelligence platform designed to simplify complex option-chain activity into a one-screen dashboard of resistance, spot, support, OI trends, market insights, live ladder levels, and chart-based confirmation.

1

Capture live structure

NiMA monitors spot price, support, resistance, option-chain activity, writer participation, and PCR.

2

Measure pressure

The system combines support pressure and resistance pressure into a Net Market Pressure reading.

3

Evaluate insight windows

Market Insights compares writer, PCR, spot, and pressure changes over the selected 3 to 60 minute window.

4

Show bias context

The dashboard returns bullish, bearish, or neutral context with watch zones, available range, and live condition blocks.

Documentation

Every module explained beside the relevant dashboard view.

Explore every analytics engine, chart, structural indicator, account flow, and interpretation framework inside NiMA. Each section explains what the system measures, how the dashboard presents it, and how users can read evolving market structure without treating the output as advisory guidance.

Resistance engine preview

1. Resistance Engine

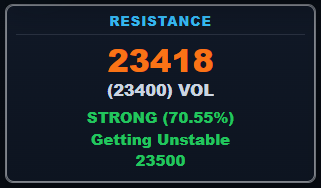
The Resistance Engine identifies the strongest overhead resistance zone using live call-side open interest, volume concentration, and option-chain positioning.

NiMA continuously evaluates:

  • Maximum Call Open Interest
  • Call Volume Concentration
  • Resistance tendency and stability
  • Upper and lower resistance references
  • Structural Stability
  • Resistance pressure context
Stable resistance and weakening resistance are market-context readings. Users should combine them with independent analysis and risk controls.
Support engine preview

2. Support Engine

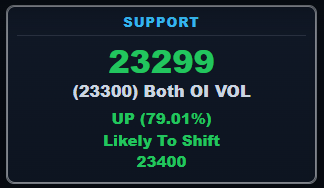
The Support Engine identifies the strongest downside support zone using put-side open interest, volume concentration, and live option-chain participation.

NiMA continuously evaluates:

  • Maximum Put Open Interest
  • Put Volume Concentration
  • Support tendency and stability
  • Upper and lower support references
  • Structural Stability
  • Support pressure context
Strong stable support can be read as one market-context input. Weakening support may reflect changing writer participation and should be evaluated with independent judgement.
Spot engine preview

3. Spot Engine

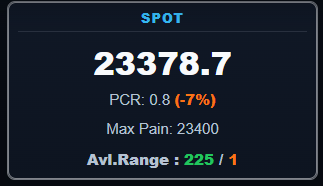
The Spot Engine represents the real-time center of the NiMA analytics framework. It continuously tracks live NIFTY movement together with market structure interpretation.

The Spot card combines:

  • Live Spot Price
  • Dynamic PCR Analysis
  • Directional Pressure
  • Available range context
  • Max Pain Analysis
  • Nearest support and resistance references
Spot behavior near support and resistance is shown as context only. It should not be read as an instruction to act in the market.
Market Insights engine preview

4. Market Insights Engine

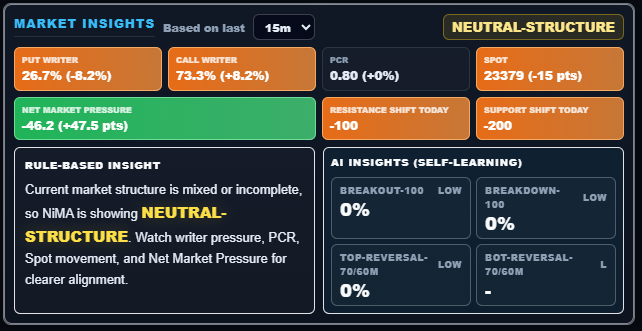
The Market Insights Engine combines rule-based structure reading with self-learning AI model insight. It evaluates spot position, support and resistance behavior, writer activity, PCR movement, market pressure, and time-window based condition changes.

The rule-based block reads live structure conditions and shows neutral, bullish, bearish, breakout, breakdown, support up-shift, or resistance down-shift context only when the active scenario conditions align. The AI block separately displays four self-learning model probabilities for defined event types.

  • Rule-based insight for live market structure and bias context
  • AI model probabilities for Breakout100, Breakdown100, TopReversal, and BottomReversal
  • Time-window condition blocks for 3m, 5m, 10m, 15m, 30m, and 60m comparison views
  • Direct use of OI Trend writer values and Spot-card PCR values for bias reading
  • Support up-shift and resistance down-shift structure detection
  • Reference zone, next reference zone, and available range context
  • Put writer, call writer, PCR, spot, and Net Market Pressure condition blocks
The rule-based insight and bias are not tied to the selected time dropdown. The dropdown is used for the condition blocks, while the AI models learn from stored market snapshots and update their probability context from current live structure.
OI trends and market sentiment preview

5. OI Trends & Net Market Pressure

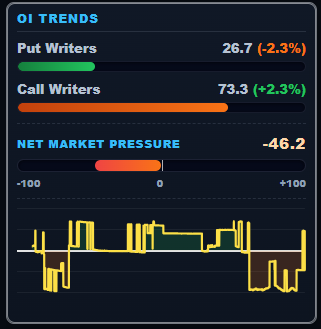
This is the writer-pressure and sentiment engine of NiMA. It measures the evolving balance between call writers and put writers in real time, then adds a Net Market Pressure scale for directional context.

The Market Sentiment Engine combines:

  • PCR trend changes
  • Writer pressure imbalance
  • Directional flow shifts
  • Put writer and call writer bracket deltas
  • Resistance pressure and support pressure
  • Net Market Pressure from -100 to +100
Positive Net Market Pressure indicates stronger upward pressure, while negative values indicate stronger downward pressure. Zero is treated as neutral.
Live spot ladder and smart action strip preview

6. Live Spot Ladder & S/R strength

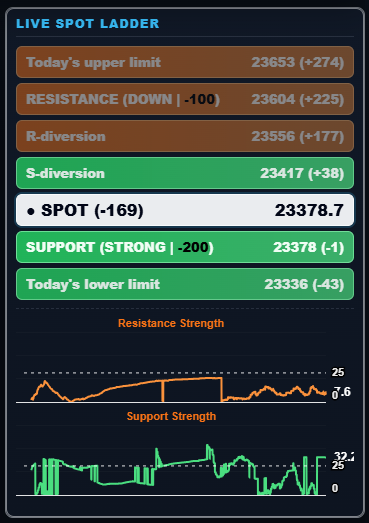
The Live Spot Ladder provides a compact real-time market map around the current NIFTY spot price. The confidence strip sits close to the ladder so users can read critical level context without losing the price map.

  • Current spot position
  • Nearest resistance and support levels
  • Critical breakout zones
  • Critical level confidence
  • User-friendly pressure context
  • Bias context zone
This section helps users quickly understand market condition during fast intraday volatility without manually analyzing multiple charts simultaneously.
Live analytics charts preview

7. LIVE Analytics Charts

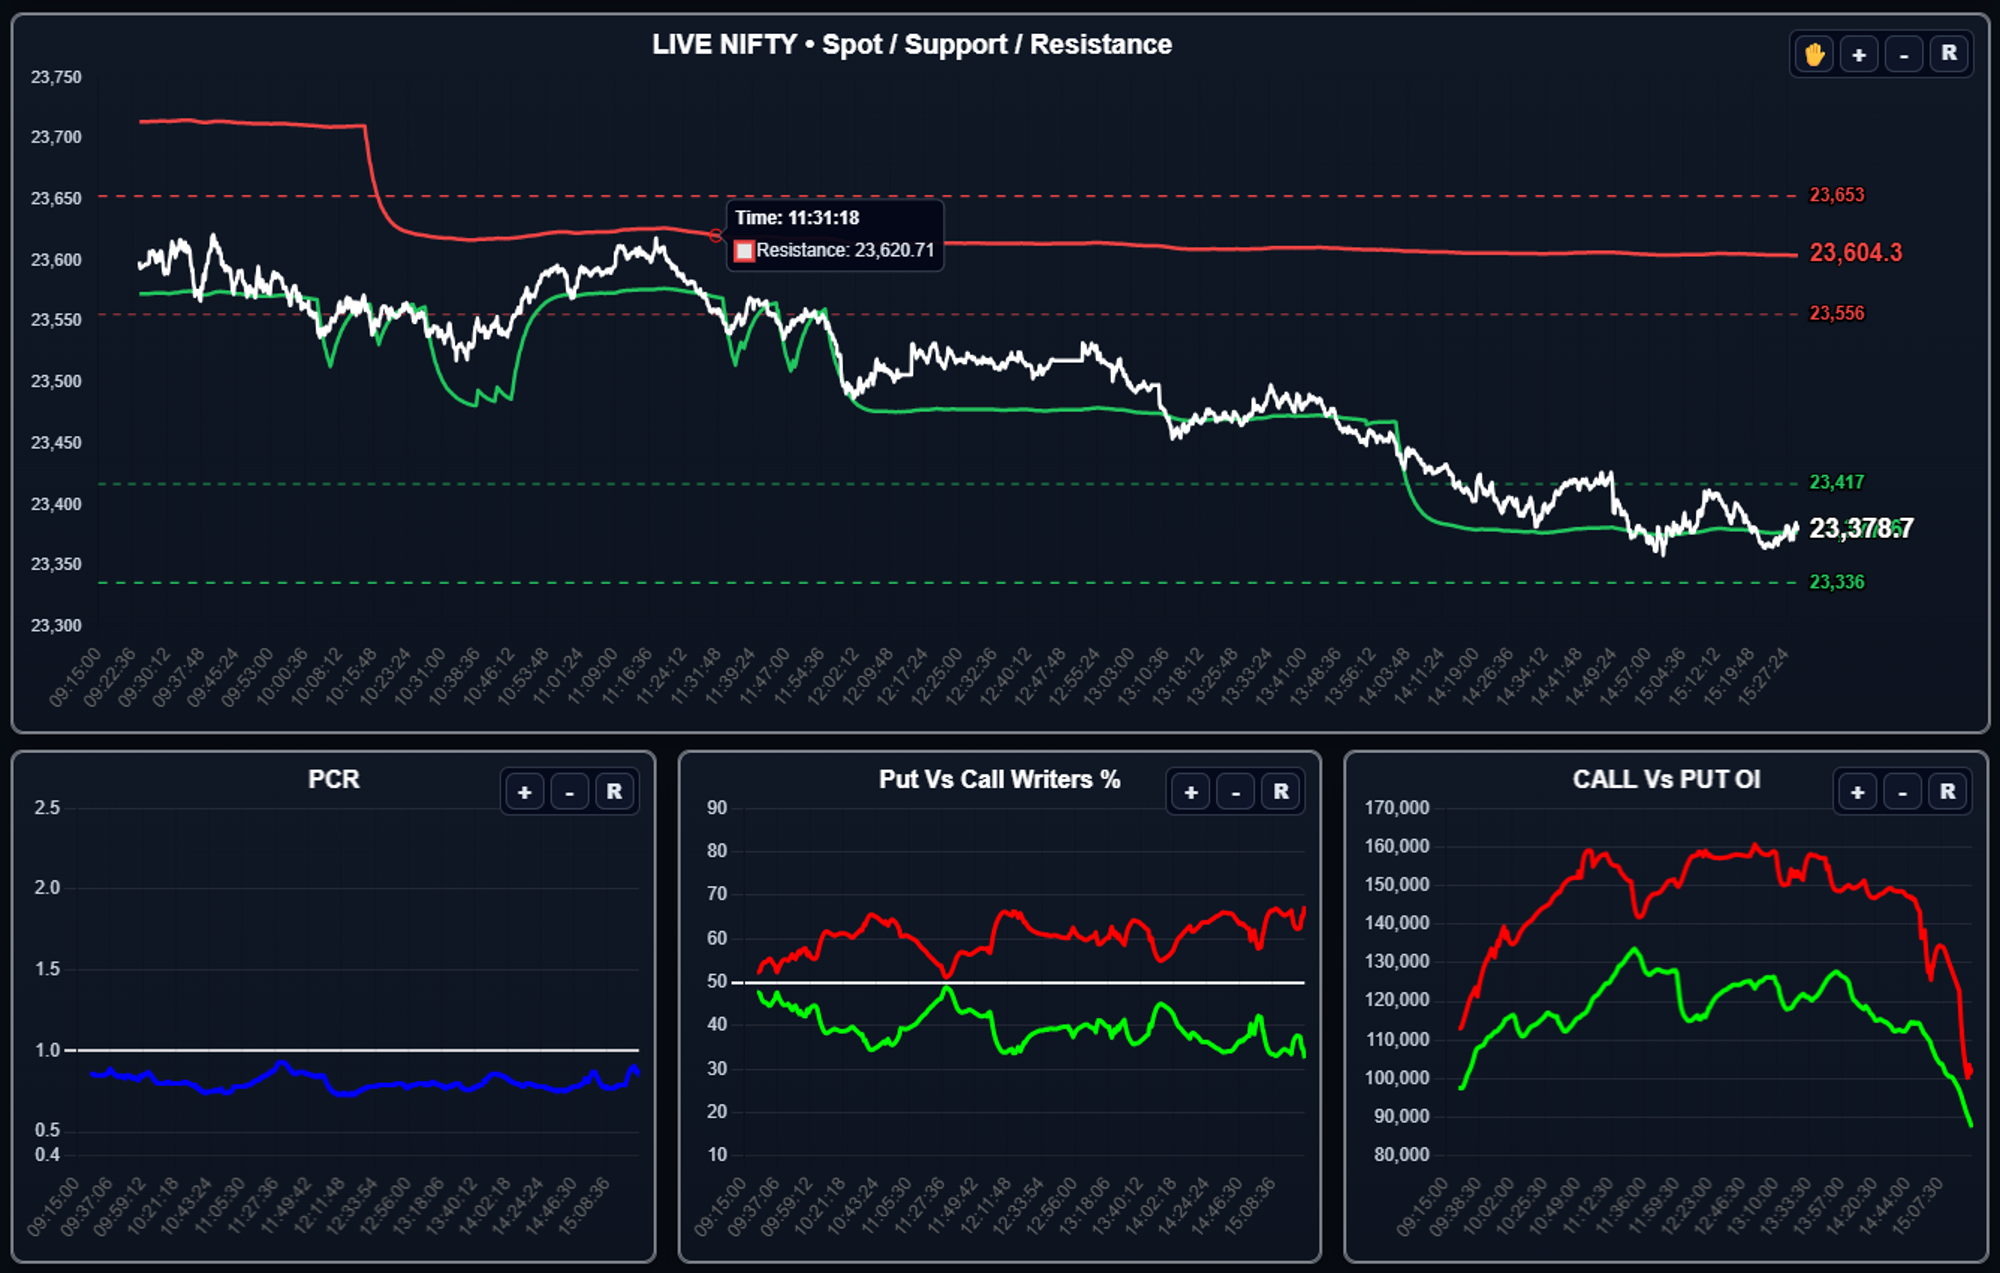
NiMA contains seven live analytics charts that visualize price structure, writer behavior, PCR, open interest, market pressure, and support/resistance strength across the session. Historical rows are loaded into the charts for intraday replay, and the dashboard can export analytics as CSV.

  • Chart 1: Live NIFTY spot with Resistance, Support and previous-day high/low references
  • Chart 2: Market PCR trend with a highlighted PCR 1.0 reference line
  • Chart 3: Put Writers % versus Call Writers % with the 50% balance line
  • Chart 4: Call OI versus Put OI trend for open-interest balance
  • Chart 5: Raw Net Market Pressure from -100 to +100, de-linked from smoothing
  • Chart 6: Resistance strength based on resistance tendency strike percentage
  • Chart 7: Support strength based on support tendency strike percentage
  • Zoom, pan, smoothing controls for main charts, and CSV export for session review
Together, these charts provide a live and historical view of how spot, PCR, writers, OI pressure, and support/resistance strength evolve during the trading session.
Bias log and option chain table preview

8. Option Chain Table

The Bias Log records generated bullish, bearish, and neutral context events together with trigger reference, timing, movement tracking, maximum favorable movement, maximum adverse movement, and efficiency-style analytics.

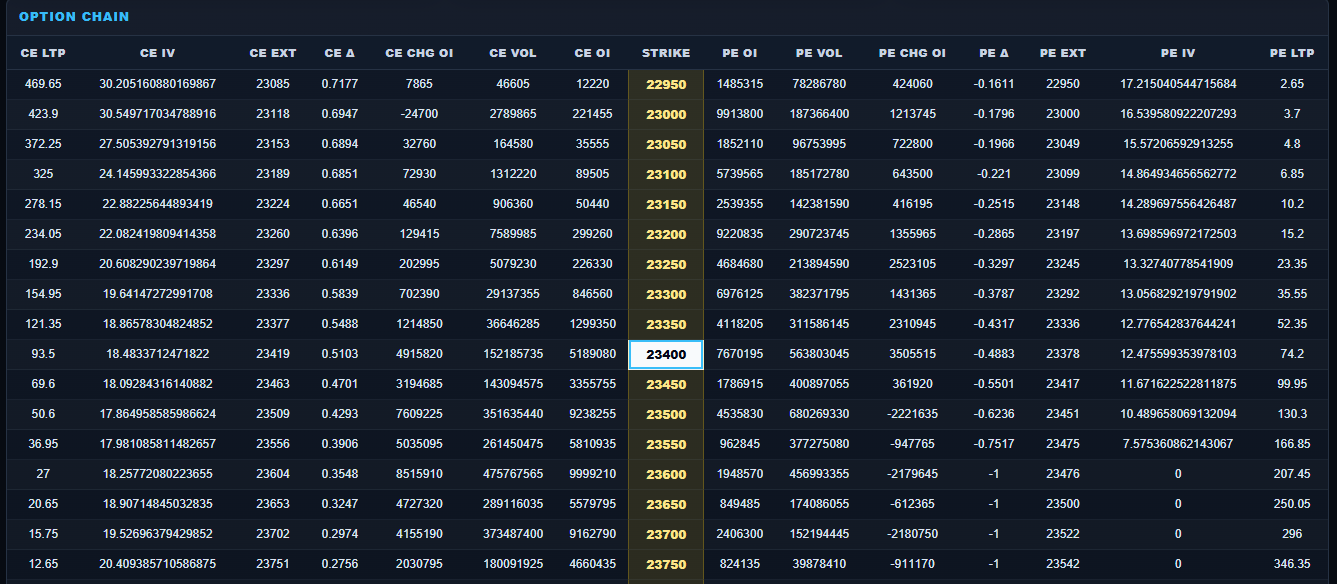
The Option Chain Analytics Table displays:

  • Open Interest and Change in Open Interest
  • Volume and Implied Volatility
  • Delta and live option pricing
  • Extension Levels
  • ATM strike highlighting
  • Concentration zones around active strikes
Advanced users can use this table for detailed order-flow interpretation and institutional positioning analysis.
Account access and dashboard preview

9. NiMA Dashboard as Real DSS

NiMA Dashboard works as a real-time Decision Support System for NIFTY option-chain study. It brings price levels, writer pressure, PCR, market pressure, AI event probabilities, rule-based structure reading, charts, ladder context, and option-chain details into one operating screen.

The dashboard helps users observe market structure through:

  • Resistance, Spot, and Support cards with live PCR and available range context
  • Market Insights combining rule-based reading and self-learning AI event models
  • OI Trends and Net Market Pressure for writer-side strength and pressure balance
  • Live Spot Ladder for quick level mapping around current spot
  • Seven live analytics charts for session replay and structural confirmation
  • Option Chain table with OI, change in OI, volume, IV, delta, LTP, and extension values
  • AI Model Performance panel showing reliability, caught-event recall, balance, and actual event windows
NiMA is designed as a decision-support dashboard for structured observation and learning. It presents market context and probabilities; it does not provide investment advice or execution instructions.
Pricing

Simple pricing for live market intelligence.

Start with a free trial, verify your email, and evaluate whether NiMA fits your market workflow before choosing a paid plan.

NiMA Monthly Access

Includes the live dashboard, finalized resistance/spot/support cards, OI Trends with Net Market Pressure, Market Insights with selectable comparison windows, AI insights, analytics charts, option-chain interpretation tools, account access controls, and support details.

₹999 / 30 days
Quarterly saves ₹97 · Annual saves ₹389
View All Plans

Experience NiMA free for 5 days.

Explore live market structure analytics, writer pressure, dynamic support-resistance zones, Market Insights, Net Market Pressure, and option-chain visualization in one professional dashboard after email verification.

Create Free Account